I modernize old BI stacks and give them AI that understands your business.
I’m Mojtaba Peyrovi, a Berlin-based data, BI and applied AI consultant. I help growth-stage companies replace slow, expensive reporting systems with analytics that are faster, cheaper to run and accurate. The core of that foundation is a knowledge graph of your business: it understands your metric definitions, stays current as your company changes and gets smarter over time, so your AI agents give answers that fit your business rather than generic ones.
Fractional data leadership · BI modernization · Applied AI workflows



Four ways to fix the layer underneath your reporting.
Pick the one that matches where the pain actually is. Most engagements start narrow and prove value before expanding.
Fractional Head of Data
Senior direction for teams that need a data leader but aren't ready to hire one full-time. KPI strategy, roadmap, hiring support.
3–12 monthsBI & Reporting Modernization
Dashboards that exist but nobody trusts. I clean up the metric layer underneath so the numbers finally agree with each other.
4–12 weeksMarketing Analytics & Attribution
GA4, campaign data, and funnel logic joined into one view, so you know what's actually driving revenue.
3–10 weeksApplied AI Workflow Prototyping
RAG systems, internal assistants and agentic workflows, built with evaluation and human review, not hype.
2–8 weeksLower costs, accurate KPIs, faster decisions.
Over more than ten years across Hong Kong, Thailand, and Germany, I’ve reduced analytics costs by tens of thousands of euros a year, brought reporting accuracy above 98% and given leadership teams KPIs they could build growth plans on. I’ve also trained over a hundred people to use data on their own. Now I help companies add AI on top of that foundation, so it gives tailored, reliable answers.
A few of the systems built along the way.
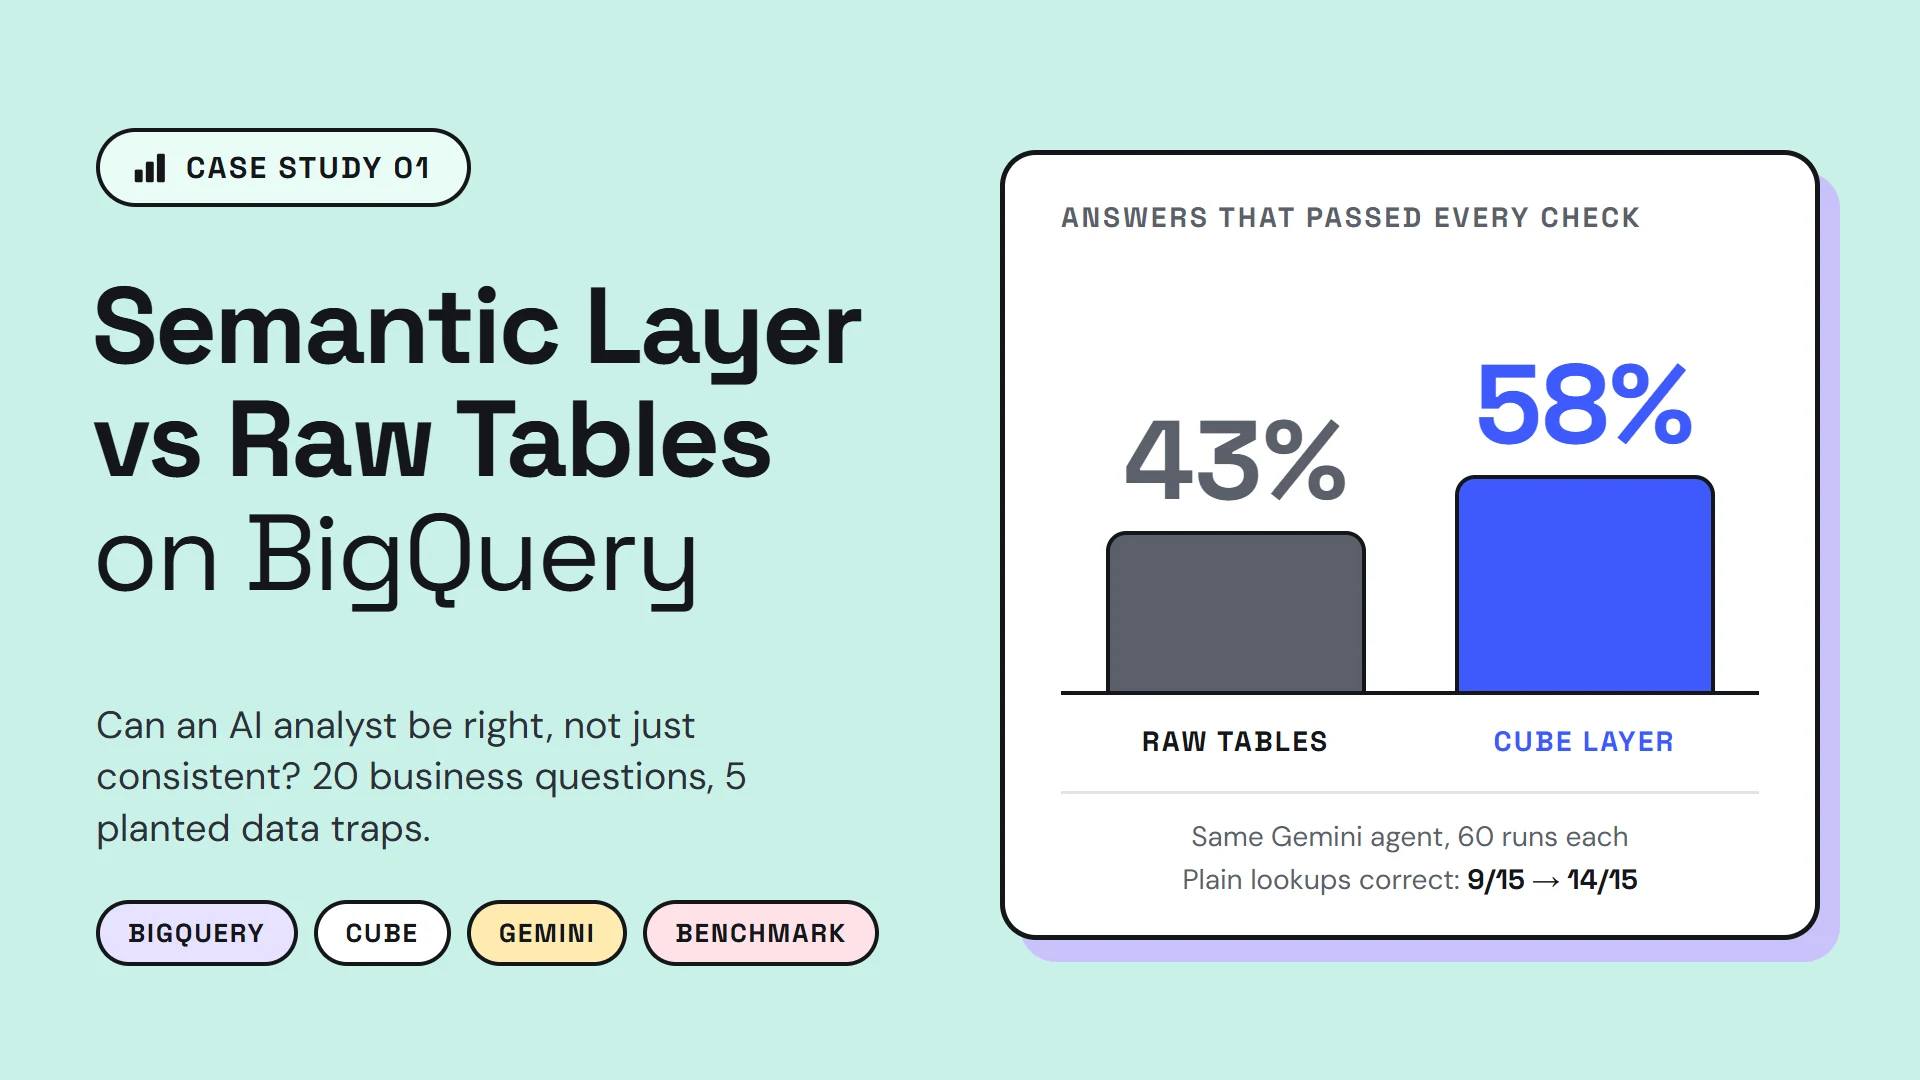
Does a semantic layer make AI analysts right?
A benchmark with five planted data traps: 58% of AI answers passed through a governed Cube layer vs 43% on raw BigQuery tables.
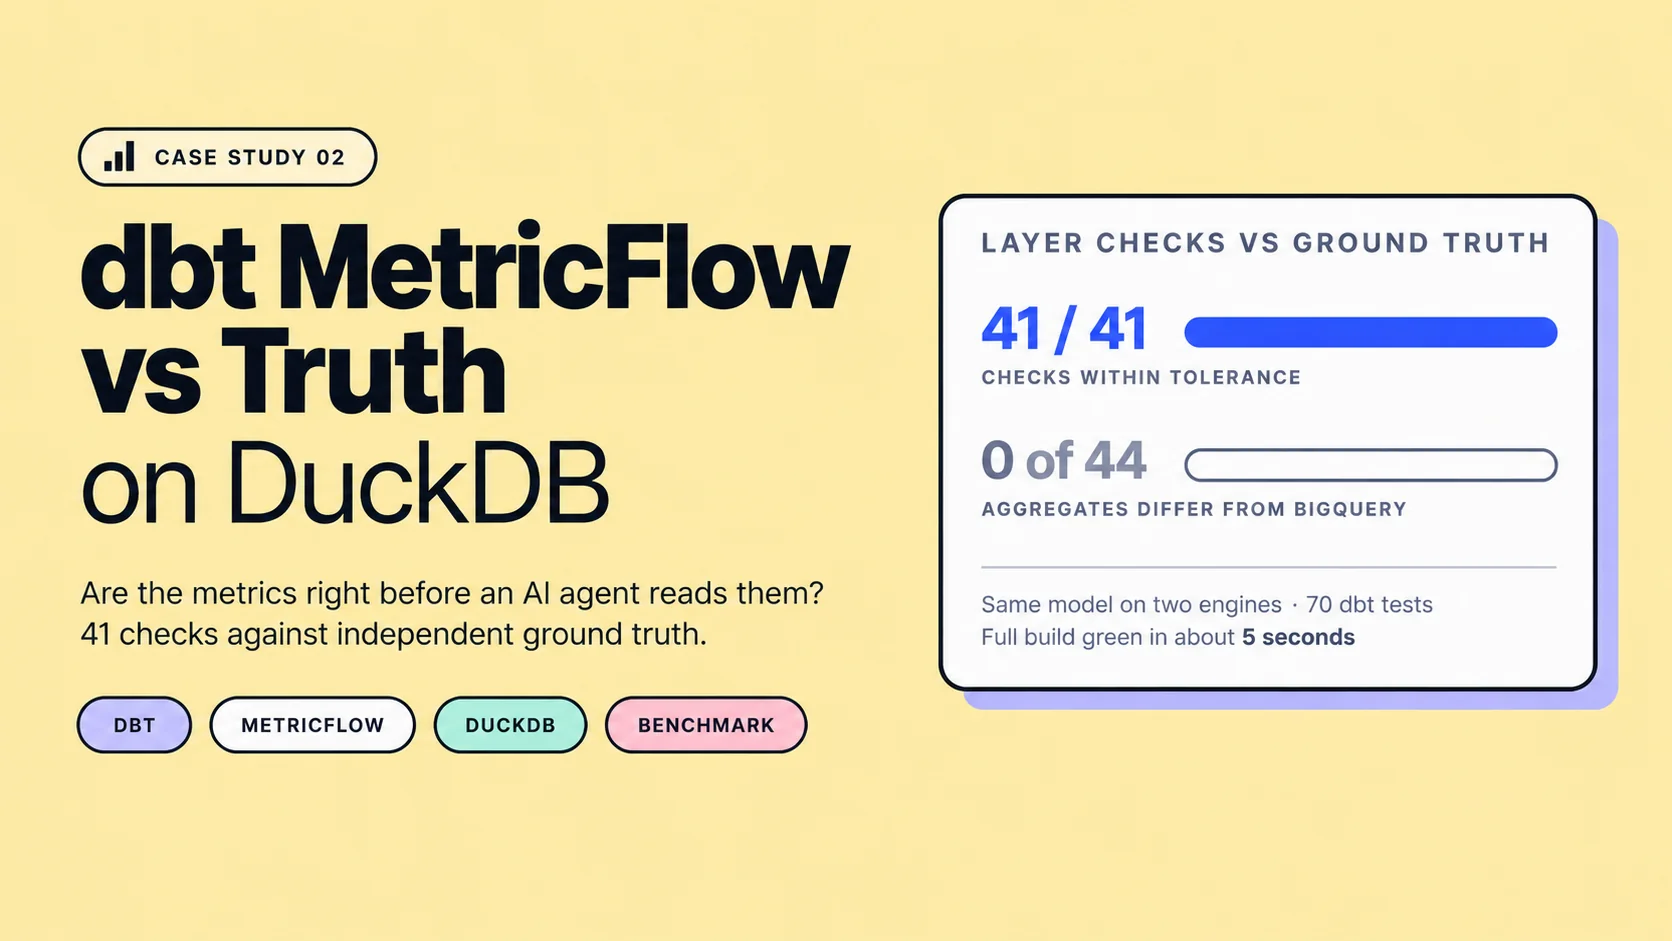
Prove the metrics are right before AI reads them
The same benchmark on dbt Core and MetricFlow: 41 of 41 checks within tolerance of ground truth, and 0 of 44 aggregates different from the BigQuery build.
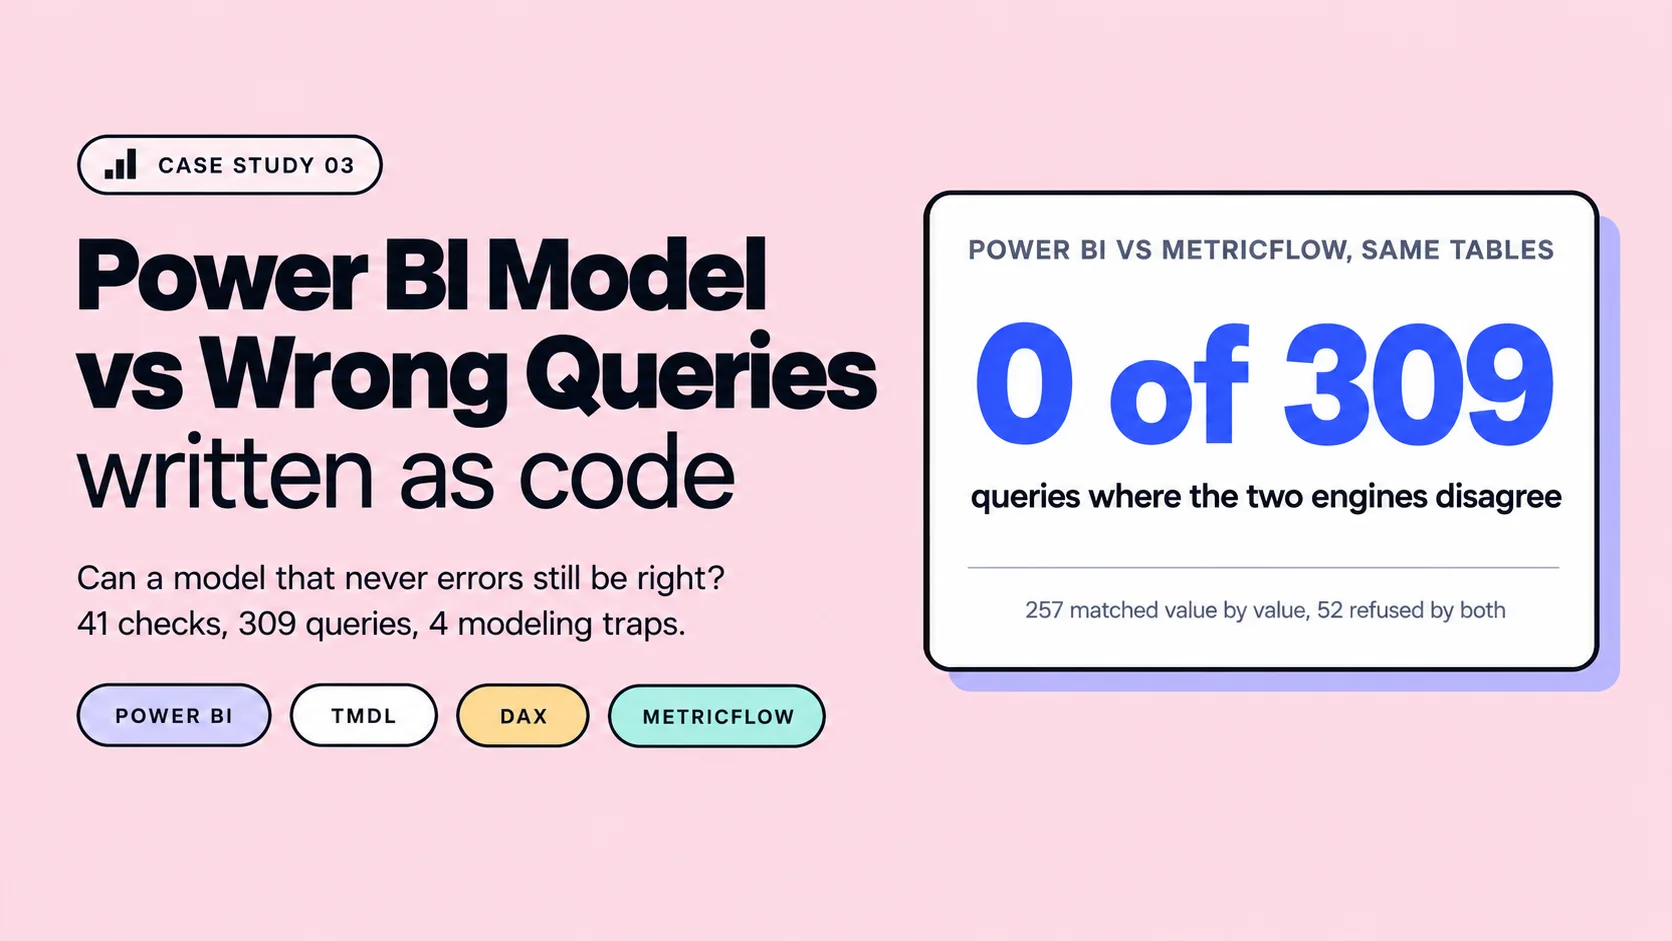
Power BI never refuses a wrong query. So the layer has to.
The same benchmark on a Power BI model written as code: 41 of 41 checks within tolerance of ground truth, and 0 of 309 queries where it disagrees with MetricFlow.
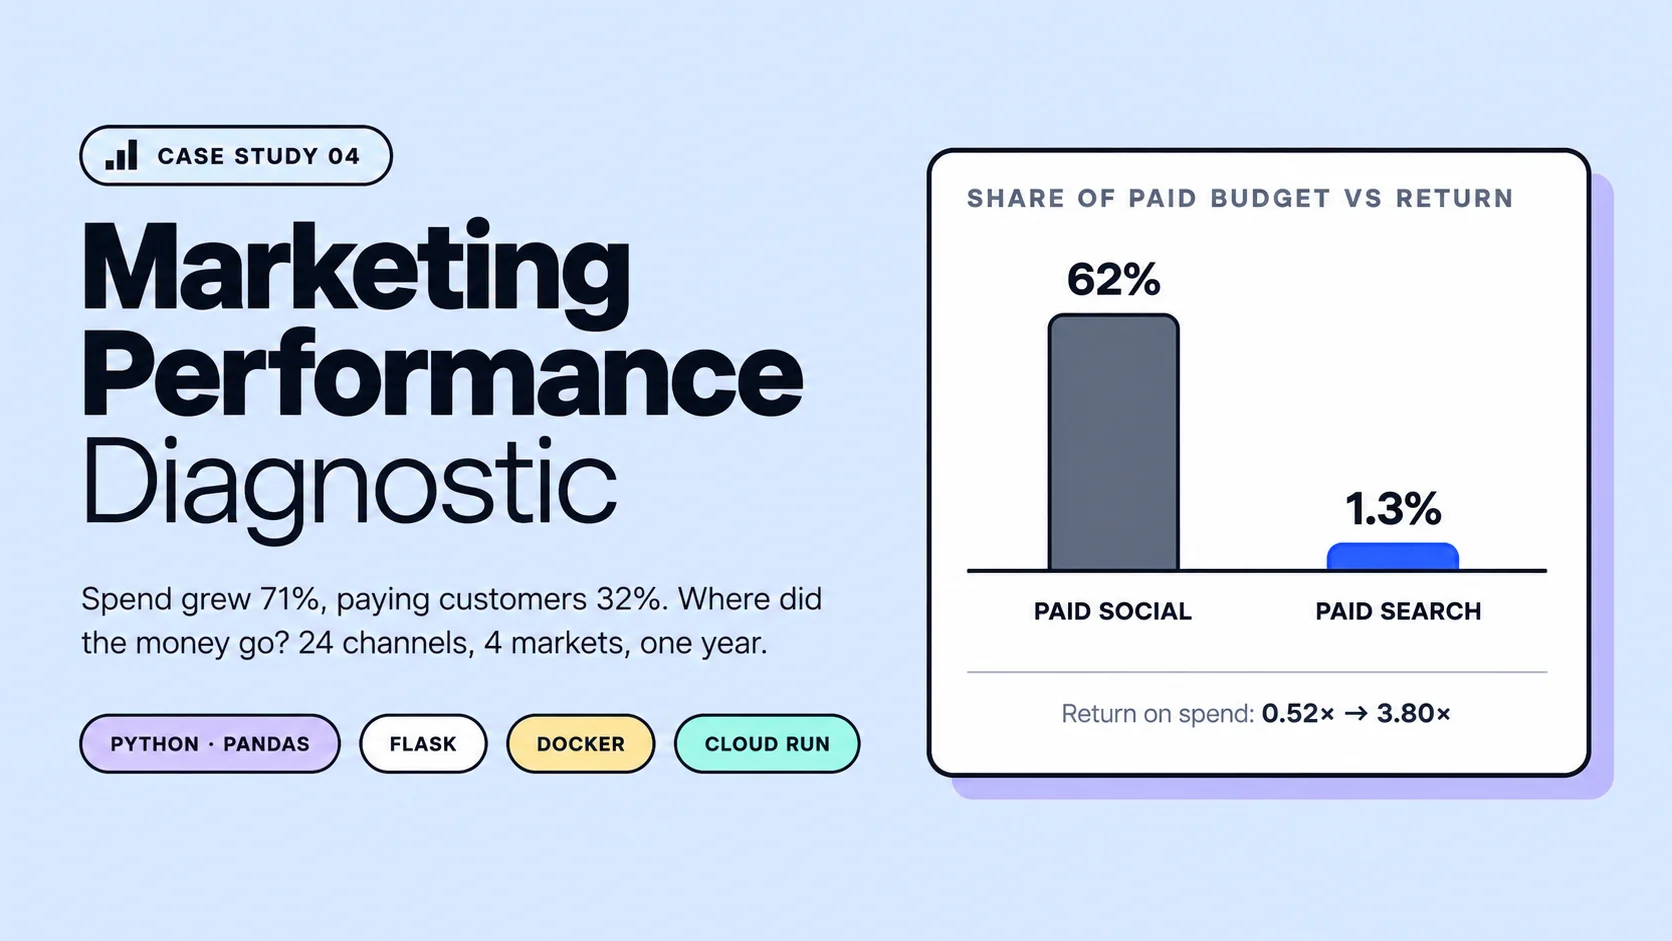
Spend grew 71%. Paying customers grew 32%. Where did the money go?
A marketing diagnostic on a year of campaign data: 62% of paid budget at 0.52× return, and a €1.3M reallocation at the same total spend.
More case studies coming soon.
Tell me what's not working with your data.
One message is enough to start. I'll reply within a business day, usually with a question rather than a pitch.
Prefer email? moji@klarix.consulting
If it's a fit, I'll suggest either a short call or, if the scope's already clear, a proposal directly.