
Power BI never refuses a wrong query. So the layer has to.
I rebuilt the same semantic layer a third time, as a Power BI model written in TMDL text files under git, on the exact tables from case study 02. Then I tested it against independent ground truth, against a second engine, and against four modeling mistakes that are common in real Power BI models.
41 / 41
layer checks within tolerance of ground truth; all but one exact to floating-point rounding
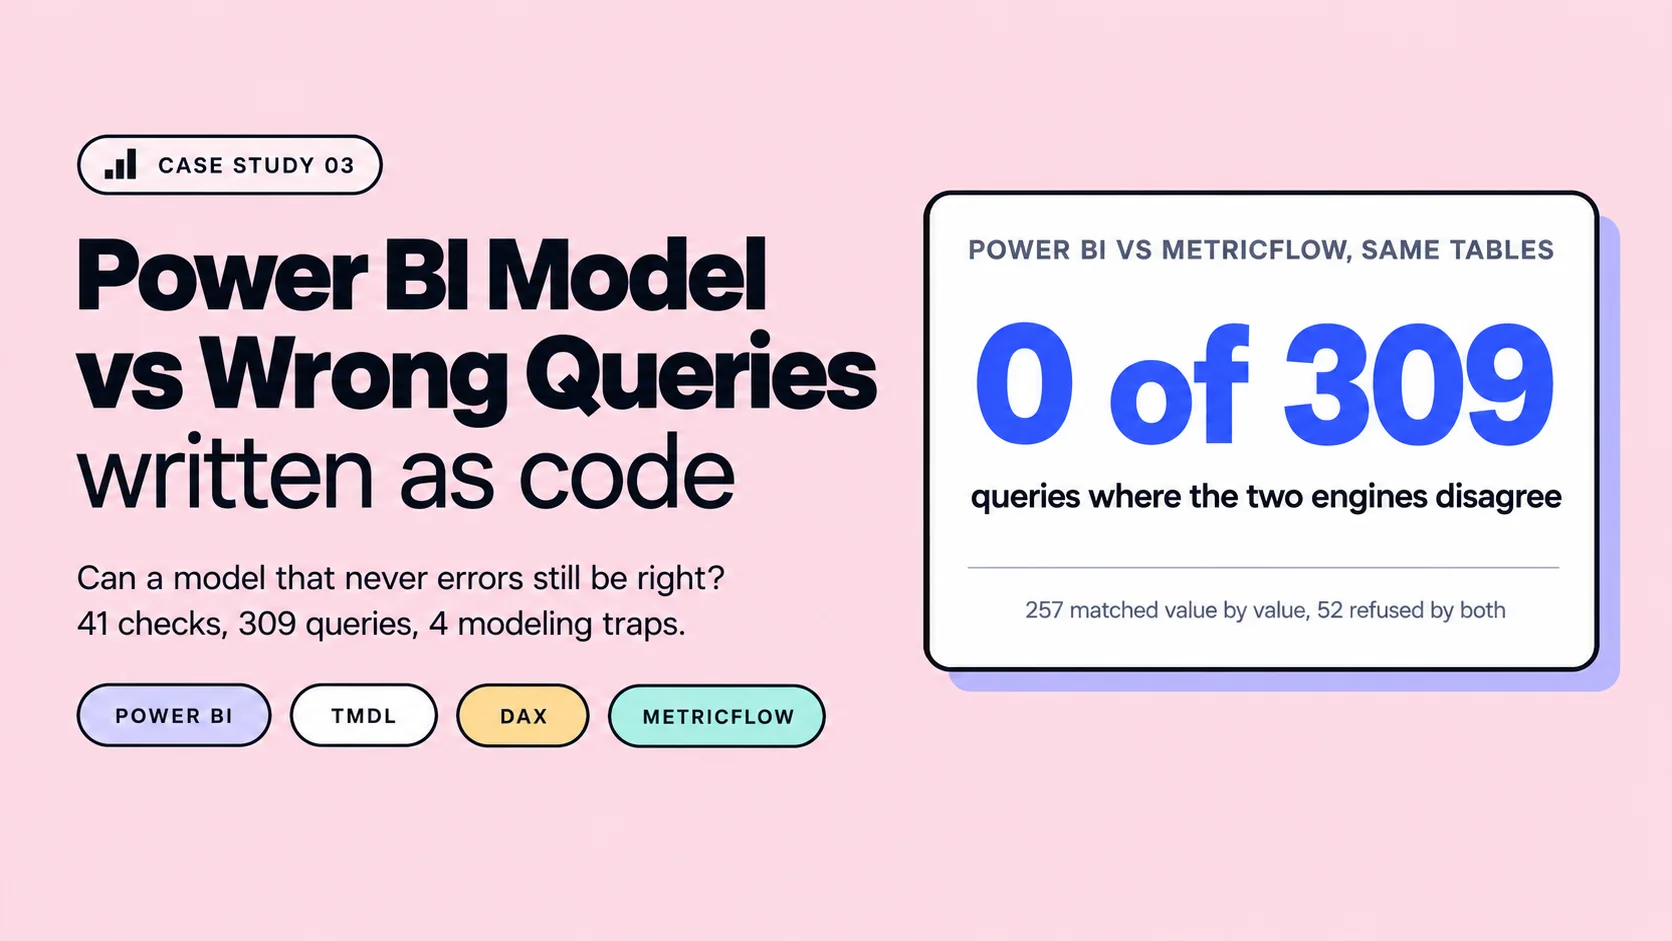
0 of 309
queries where Power BI and MetricFlow disagree on the same tables
95 tests
run on the model's text files on any OS, without Power BI Desktop
+8.5%
August orders when one measure skips the shared base measure, with no visible error
Scope, stated up front
This case study is scoped to the semantic layer. Everything on this page was measured against a live Power BI Desktop: correctness against truth, parity with a second engine, and the traps. No agent was run against this stack, so the page contains no agent pass rates and nothing on it implies otherwise.
My role: solo build, covering the Power BI model, the DAX compiler and backend, the tests and the traps suite.
The question
The tool many business users already have open fails in quieter ways.
In Power BI, the semantic model (tables, relationships and DAX measures) sits between the data and every report. Ask it the wrong question and DAX does not raise an error. A filter that cannot reach a measure is ignored, and a group-by on an unrelated table repeats the same total on every row. Cube and MetricFlow refuse the same queries.
The model is also a graph of relationships. One relationship set to filter in both directions, or one measure written without the shared rules, can change a number while every report still looks fine. And the engine that runs it lives inside a desktop app, so getting the model into git, testable and queryable by a program, is real work.
Same benchmark, third stack
Same tables as case study 02. Only the semantic layer changed.
The data, planted problems, questions, scorers, judge and prompt are identical to case study 01 and case study 02. The model imports case study 02's star schema, exported to Parquet unchanged, so any difference from truth comes from the Power BI model and nothing else.
| Case study 01 | Case study 02 | Case study 03 | |
|---|---|---|---|
| Tables | BigQuery star schema | dbt star schema in DuckDB | The same dbt star schema, imported from Parquet |
| Semantic layer | Cube Core (YAML) | MetricFlow (dbt YAML) | Power BI model as TMDL text files |
| Metric language | Cube measures | MetricFlow metrics | DAX measures |
| Engine | Cube on BigQuery | MetricFlow on DuckDB | The engine inside Power BI Desktop |
| Runs on | Cloud and Docker | Any laptop | Windows with Power BI Desktop |
How it is built
A Power BI model a program can read, test and query.
The question the agent sends
metrics: [orders]
time_dimension: order_created
range: 2026-08-01 to 2026-08-31
The DAX the backend runs
EVALUATE
SUMMARIZECOLUMNS(
  FILTER(
    ALL('Order Date'[Date]),
    'Order Date'[Date] >= DATE(2026, 8, 1)
      && 'Order Date'[Date] <= DATE(2026, 8, 31)
  ),
  "orders", [orders]
)
Model as code
"Model as code" is half true in Power BI. Both halves matter.
Model design
Five design choices that keep the model honest.
The planted problems
The same five traps, handled the Power BI way.
The numbers in the last column were checked live against the open model.
| ID | What is wrong in the data | Handled? | How, in the Power BI model |
|---|---|---|---|
| P1 | "Revenue" is ambiguous. Gross includes returned items, net does not. | Left open | Both measures exist under separate names, and each description says what it includes. |
| P2 | A category is renamed mid-window (Sweaters to Knitwear). | By design | A category family maps both names to one line. Sweaters ends and Knitwear starts in October 2025 (200 and 211 items a month, then 201 and 201), while the family stays one continuous line. |
| P3 | Consent loss nulls the acquisition channel and session source. | Visible only | Missing values become "Unattributed", and attribution coverage drops from about 1.0 to between 0.69 and 0.72 from March 2026. The true source cannot be recovered. |
| P4 | Internal and test accounts inflate order counts and distort repeat rate. | By design | Every base measure excludes them. A test checks each base measure carries the filter exactly once, and a graph walk checks every catalog measure reaches data only through one. |
| P5 | A small, real cohort returns far more items, invisible at channel level. | Structurally | Cohort month is a dimension, so return rate can be sliced by it. Whoever asks still has to choose to look there. |
Results
All three layers reach truth to the same limit.
Every catalog metric over the full 24-month window, compared with a number recomputed from the clean world by separate code. No LLM was involved. The same suite runs against all three stacks.
| Layer | Checks | Largest deviations from truth | Tolerance |
|---|---|---|---|
| Power BI | 41 | Repeat purchase rate 0.22%; every other check about 4e-15 (floating-point rounding) | 0.5% |
| MetricFlow (case study 02) | 41 | Repeat purchase rate 0.22%; every other check about 1e-15 | 0.5% |
| Cube (case study 01) | 41 | Repeat purchase rate 0.22%, orders 0.077%, purchasing customers 0.051%, the rest near exact | 0.5% |
The 0.22% gap is the same in all three, because it comes from the shared cohort rule (a second order within 90 calendar days) against truth's exact timestamps. It is a property of the shared tables, not of any layer.
Two engines, same tables
309 queries through Power BI and MetricFlow
257
returned data on both and matched value by value
52
refused by both, because the dimension cannot reach the metric
0
answered by only one of the two
0
differ; the largest gap is 1.1e-14
Engine differences, not errors
DAX ignores case when it compares text
2,757 brand strings become 2,718 groups, because "BluePrint" and "Blueprint" merge. SQL keeps them apart.
Empty groups disappear
DAX drops a group where every measure is blank; MetricFlow lists it with null or zero.
Blank is not zero
DAX returns blank for an empty slice, counts included. MetricFlow returns 0 for its four distinct counts.
| fct_order_items | 175,804 | dim_customer | 97,447 (1,000 internal) |
| fct_orders | 119,574 | dim_product | 30,858 |
| fct_sessions | 663,100 | mart_customer_cohorts | 97,446 |
| dim_distribution_center | 11 | date tables (three) | 2,828 each |
Power BI traps
Four common modeling mistakes, the wrong numbers they produce, and the test that catches each.
Each trap is switched on inside a single query or in a throwaway copy of the model; the committed model never changes. The real tests run twice, on the correct model and with the trap on, and a test only counts as a catcher if it goes from passing to failing. Window: September 2024 to August 2026.
| Trap | Query | Wrong | Truth | Deviation | Caught by |
|---|---|---|---|---|---|
| T1 Bidirectional relationship | Every accepted query, 7 candidate relationships | unchanged | · | 0 moved | Static test only |
| T2 Measure skips the base measure | Orders, August 2026 | 5,026 | 4,633 | +8.5% | Static graph walk; layer test |
| T3a Summed ratio | Return rate, full window | 2.7581 | 0.1147 | +2,304% | Two static tests; layer test |
| T3b Averaged ratio | Return rate, full window | 0.1149 | 0.1147 | +0.2% | Two static tests; the layer test misses it |
| T3c Implicit measure | Sum of sale price, August 2026 | 457,776 | 382,760 | +19.6% | Two static tests |
| T4 Unrelated group-by | Sessions by category, sum of rows | 18,566,800 | 663,100 | 28 times | Compiler and contract tests |
Agent evaluation
A layer that cannot be shown correct is not ready for an agent.
No agent runs were made for this stack, so this page reports no agent pass rates. The study is scoped to the layer on purpose. The agent harness is the same for every stack, and its behaviour on a governed layer is measured in case study 01. What is specific to Power BI is the model: its relationships, its DAX and its settings. That is where this study puts its tests.
Everything an evaluation needs is in place: the Power BI backend is registered in the shared runner, serves the same metric contract, and compiles DAX so a language model never writes it. The same 20 questions, scorers and judge apply unchanged.
Three stacks, same benchmark
What building the same layer three times showed.
Engineering findings
Found while building, not in the documentation.
A filter that was silently ignored
New customers filtered by category returned the unfiltered 67,180, because category cannot reach that measure and DAX does not complain. The compiler now refuses the query and says which dimensions do work.
A coverage rate of 24.5
A bare filter inside a measure replaced the query's own grouping on the same column, so one channel showed a coverage rate far above 1. A static test now allows a bare filter only on hidden columns.
Groups that vanished instead of showing zero
Dividing a blank by a number gives blank in DAX, so a group with sessions but no conversions disappeared. The ratio numerators now default to zero.
The date table Power BI would not accept
The star schema's unknown-date row has no date, which blocks "mark as date table". The three date tables drop that row when they load.
Finding the engine is the first problem
Desktop starts a private engine on a random port and names the database with a random ID. The Store build writes the port file somewhere else than documented. The backend recognises the right model by its tables.
Overriding a measure only goes one level deep
Redefining a hidden measure inside one query changes nothing, because other measures keep the model's version. The traps override the measure the query actually names.
Honest limitations
What this case study does not cover.
Privacy
Everything runs locally on Windows. No LLM is called in this project, and queries and results stay on the machine. The data is Google's public, synthetic theLook dataset; no real customer data is involved at any point.
The series
01: BigQuery and Cube, with full agent results. 02: dbt and MetricFlow, the layer proven against truth. 03: Power BI, on the same tables as 02. Same data, same questions, same judge across all three.